Right Ventricular Hypertrophy (RVH) on the ECG
Right ventricular hypertrophy on the ECG is a pattern of increased right ventricular forces, characterised by a dominant R wave in lead V1, right axis deviation, and often a strain pattern of ST depression and T inversion in the right precordial leads.
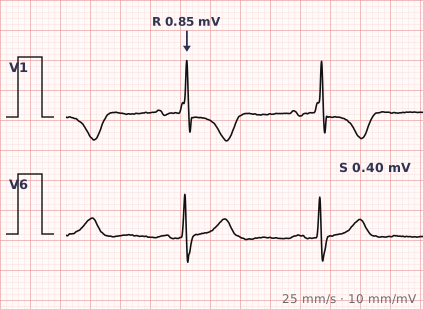
ECG criteria
| Feature | What you see in RVH |
|---|---|
| V1 | Dominant R wave — R/S ratio greater than 1, or R ≥ 7 mm. |
| Axis | Right axis deviation, beyond +90°. Almost always present, and its absence argues against RVH. |
| V5–V6 | Deep S wave — the forces are pulled rightward and away from the left-facing leads. |
| Strain | ST depression and T inversion in V1–V4 and the inferior leads, discordant to the dominant R. |
| QRS | Normal duration. Widening suggests right bundle branch block rather than pure hypertrophy. |
| Supporting | Right atrial enlargement is frequently present and strengthens the case. |
How to spot it
- Look at V1. A dominant R wave there is abnormal in an adult and is the starting point for RVH.
- Check the axis. Right axis deviation should accompany it — RVH without right axis deviation should make you doubt the diagnosis.
- Look for a deep S wave in V5 and V6, showing the forces have shifted rightward.
- Look for right precordial strain — ST depression and T inversion in V1 to V4.
- Check lead II for tall peaked P waves, since right atrial enlargement often accompanies RVH.
- Exclude the mimics before committing, particularly posterior infarction and right bundle branch block.
What it gets confused with
| Looks like | How to tell them apart |
|---|---|
| Right bundle branch block | RSR' in V1 with QRS ≥ 120 ms. RVH keeps a normal QRS duration. |
| Posterior myocardial infarction | Tall R in V1 with ST depression in V1–V3 and a normal axis. Posterior leads clarify it. |
| WPW with a left-sided pathway | Short PR with a delta wave producing a tall R in V1. |
| Normal in children and neonates | Right ventricular dominance is normal in the first weeks and months of life. |
| Lead misplacement | V1 and V2 placed too high produce misleading right precordial patterns. |
Traps
- Right ventricular dominance is normal in neonates and young children. A tall R in V1 with right axis deviation at three days old is expected and means nothing; the same tracing in an adult is abnormal. This is the single most important age-dependent finding on the ECG.
- Posterior infarction is the mimic that matters most in adults. A tall R in V1 with ST depression in V1 to V3 should prompt posterior leads rather than a diagnosis of hypertrophy.
- Right axis deviation should be present. Its absence makes RVH unlikely.
- ECG criteria for RVH are insensitive; a normal tracing does not exclude it.
- Chronic lung disease commonly produces a mixed picture with low voltage and right axis deviation rather than tall R waves.
Why it happens
Normally the left ventricle dwarfs the right, so the mean QRS vector points leftward and posteriorly. When the right ventricle hypertrophies in response to sustained pressure overload, its mass and electrical contribution grow enough to pull the vector rightward and anteriorly. That shift is what produces the dominant R wave in the anteriorly placed V1 and the right axis deviation.
Why it matters
Right ventricular hypertrophy on the ECG signals sustained pressure overload of the right ventricle, most often from pulmonary hypertension, chronic lung disease, pulmonary stenosis or a congenital shunt. It is a pointer towards the pulmonary circulation, and it commonly appears alongside right atrial enlargement as part of a broader picture of right heart strain.
Questions
What does right ventricular hypertrophy look like on an ECG?
A dominant R wave in lead V1 with an R/S ratio above 1, right axis deviation beyond +90 degrees, a deep S wave in V5 and V6, and often ST depression with T inversion in the right precordial leads.
Why is a tall R wave in V1 normal in newborns?
The fetal right ventricle works against high pulmonary vascular resistance and is as thick as the left at birth. Right ventricular dominance therefore persists for the first weeks and months, and gradually regresses as pulmonary resistance falls.
How do I distinguish RVH from posterior myocardial infarction?
Both produce a tall R wave in V1. Posterior infarction typically shows ST depression in V1 to V3 with a normal axis, and posterior leads V7 to V9 reveal ST elevation. RVH shows right axis deviation and usually right atrial enlargement.
What causes right ventricular hypertrophy?
Sustained pressure overload of the right ventricle — pulmonary hypertension, chronic obstructive pulmonary disease, pulmonary valve stenosis, and congenital shunt lesions such as an atrial or ventricular septal defect.
References
Reading about right ventricular hypertrophy is not the same as calling it on a tracing you have never seen.
Practise on real cases in ECG Pro