ST Depression on the ECG
ST depression is displacement of the ST segment below the isoelectric baseline, which may reflect subendocardial ischaemia, ventricular strain, drug effect, or act as a reciprocal change mirroring ST elevation elsewhere.
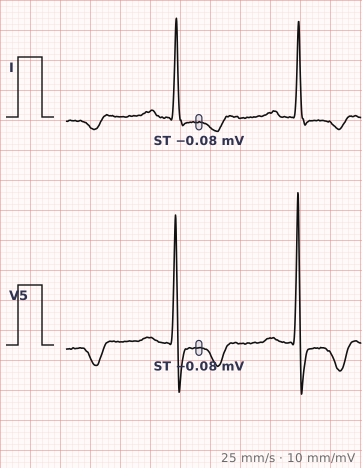
ECG criteria
| Feature | What you see in ST Depression |
|---|---|
| Threshold | ≥ 0.5 mm below baseline at the J point in two contiguous leads. |
| Horizontal or downsloping | Most suggestive of ischaemia. |
| Upsloping | Less specific; frequently rate-related and benign. Except as part of the de Winter pattern. |
| Strain pattern | Downsloping depression with asymmetric T inversion in leads with tall R waves — hypertrophy, not ischaemia. |
| Digoxin effect | Downsloping "reverse tick" or scooped ST segment, usually with a short QT. |
| Reciprocal | ST depression in V1–V3 with tall R waves suggests posterior infarction. |
How to spot it
- Measure at the J point against the TP baseline, and confirm the depression is at least 0.5 mm in two contiguous leads.
- Assess the shape. Horizontal or downsloping is more concerning; upsloping is often rate-related.
- Check the R wave height in those leads. Depression with tall R waves suggests a strain pattern from hypertrophy.
- Look at V1 to V3 specifically. ST depression there with tall R waves should prompt posterior leads before anything else.
- Consider whether this is reciprocal to elevation elsewhere — always scan the whole tracing before concluding.
- Check the drug chart for digoxin, and check the rate, since tachycardia alone produces ST depression.
What it gets confused with
| Looks like | How to tell them apart |
|---|---|
| Posterior myocardial infarction | ST depression in V1–V3 with tall R waves. Posterior leads V7–V9 show elevation. Do not miss this one. |
| Reciprocal change | ST elevation present elsewhere on the same tracing. |
| LVH strain | Downsloping depression with asymmetric T inversion in I, aVL, V5–V6, with voltage criteria met. |
| Digoxin effect | Scooped or reverse-tick depression with a short QT, at therapeutic levels. |
| Rate-related | Appears with tachycardia and resolves when the rate settles. |
| Hypokalaemia | ST depression with flattened T waves and prominent U waves. |
| Bundle branch block | Expected discordant depression as a secondary change. |
Traps
- ST depression in V1 to V3 with tall R waves is posterior STEMI until proven otherwise. It is the mirror image of posterior ST elevation, and it is the most commonly missed infarct pattern on the ECG.
- Always scan the whole tracing for ST elevation before calling depression primary. Reciprocal change is a clue pointing elsewhere, not a diagnosis in itself.
- ST depression localises poorly. Unlike elevation, it does not reliably indicate which territory is ischaemic.
- Digoxin effect occurs at therapeutic levels and does not indicate toxicity. It is a recognisable shape, not a warning.
- Widespread ST depression with elevation in aVR suggests left main or severe three-vessel disease — a high-risk pattern that is easy to under-call.
Why it happens
ST depression usually reflects subendocardial ischaemia, where the innermost myocardium — the most vulnerable to reduced perfusion — repolarises abnormally and creates a potential difference during the plateau phase. It also arises as the reciprocal image of ST elevation viewed from the opposite side, as a secondary change to abnormal depolarisation in hypertrophy and bundle branch block, and from direct drug effects on the action potential.
Why it matters
ST depression is common and much less specific than ST elevation, so its meaning depends heavily on shape, distribution and context. Two patterns are worth recognising instantly: depression in V1 to V3 with tall R waves, which signals posterior infarction, and widespread depression with aVR elevation, which suggests severe proximal disease.
Questions
What does ST depression mean on an ECG?
Most often subendocardial ischaemia, but it also occurs as a reciprocal change mirroring ST elevation elsewhere, as a strain pattern in ventricular hypertrophy, from digoxin, with fast heart rates, and in hypokalaemia.
Why is ST depression in V1 to V3 important?
Combined with tall R waves it is the mirror image of ST elevation in the posterior wall, and indicates posterior myocardial infarction. Posterior leads V7 to V9 will show the elevation directly. It is among the most commonly missed infarct patterns.
What is the difference between horizontal, downsloping and upsloping ST depression?
Horizontal and downsloping depression are more specific for ischaemia. Upsloping depression is less specific and is frequently rate-related, though it forms part of the de Winter pattern of proximal LAD occlusion.
What is the digoxin effect?
A characteristic downsloping, scooped ST segment often described as a reverse tick, usually with a shortened QT interval. It indicates the drug is present, not that the patient is toxic.
References
Reading about st depression is not the same as calling it on a tracing you have never seen.
Practise on real cases in ECG Pro